
РАЗРАБОТКА ЭКОЛОГИЧЕСКОЙ СИСТЕМЫ ПОДДЕРЖКИ ПРИНЯТИЯ РЕШЕНИЙ ДЛЯ ОЦЕНКИ КАЧЕСТВА ВОДЫ
Aннотация
Основной проблемой, рассмотренной в данной работе, является проблема оценки качества водных ресурсов, в первую очередь питьевой воды. Уровень качества воды имеет значительное влияние на здоровье человека, так как неудовлетворительное ее качество может стать причиной различных заболеваний. В данной работе представлены некоторые стратегии контроля и управления качеством воды с целью охраны здоровья человека путем создания системы поддержки принятия решений (СППР) для использования в работе сотрудников водоохранных служб и предоставления им доступа к информации, необходимой для управления водными ресурсами. Водонадзорные службы используют комплекс из 13 параметров качества воды на основе анализа индекса качества воды (WQI). Система может предлагать решения по обработке воды, таким образом, ее целесообразно использовать после определения причин и типа загрязнения. СППР для оценки качества воды изучает данные с водонадзорных и водоснабжающих станций при помощи математических моделей. Данная СППР основана на таких процессах как машинное обучение и интеллектуальный анализ данных.
Ключевые слова: Система поддержки принятия решений (СППР), СППР для оценки качества воды, качество воды, интеллектуальный анализ данных )data mining)
К сожалению, текст статьи доступен только на Английском
1. Introduction
The issue of drinking water quality is very important in the world, so a web-based decision support infrastructure has been developed to provide access to simulation results on flow water- quality conditions and to offer sophisticated scenario testing capabilities for research and water-quality planning through the graphical user interface with known controls [1]. Water crises around the world often occur because of global climate change and the increasing intensity of human activity. The main cause for water crises is the lack of sustainable methods of water resource management. In response to the real water resource management problems, a water-DSS has been designed as an easy-to-use and user-friendly interface. The DSS consists of an information management system that leads data collection, verification, management and visualization, and models estimated water demand and water distribution [2]. The management of water is a complex engineering problem that includes various technical, social, economic, environmental, cultural and legal issues depending on the various forms of uncertainties such as fluctuations, randomness, the cognitive nature of parameters and model algorithms. The application of the DSS is employed in various areas of the management of water resources such as the management of water resources, water and wastewater treatment [3]. The visualization, design and implementation of an online course on the topic of Decision Support Systems in River Basin Management is very useful to avoid the pollution crises. The Planning and Management of Water Resources increasingly depends on the ways of decision support such as simulation and Multi Criteria Analysis [4]. The drinking water networks of the surface water are weak in the short-term variation of inputs of organic matter. This affects raw water quality and increases the intensity of rainfall as well as the frequency of heavy rainfall events. These changes may strongly affect the water quality and processing operations [5]. The development steps of a decision tool prototype of geographic information systems (GIS) and the general framework are based on the decision support system of the river health diagnosis (RHD-DSS). The system integrates data, mathematical models and human knowledge on the river health status, causal factors diagnosis and restoration decision making in order to assist decision makers during river restoration and management. It has four functional components: input module, database management, diagnostic indicators management and visual result module [6]. The problem of water quality degradation and the lack of water quantity is urgent in different parts of the world [7]. The new application model for designing this software system-composite, service-oriented and multilayered web information system for the management of lakes and reservoirs describes the architecture and services of the application model, together with the structure and functionalities of the software solution [8] and is then connected with the Water Management Information System [9]. To support water quality management under hybrid uncertainties, we have developed a model-based decision support system based on a hybrid uncertain programming model with fuzzy and interval coefficients. The system provides an effective tool for decision makers in dealing with the problems of water quality and developing policies and strategies [10]. The fields of water resources, water quality and river management have greatly influenced the DSS over the past few decades, resulting in a variety of decision support systems, such as the Sonhua River. The aim of this paper is to present a DSS to support water managers and scientists who have used the predictive capabilities of the water management models. These models typically use mathematical process representations.
2. Design of the water quality-DSS
The water quality-DSS will consist of a set of guidance and software tools designed to allow decision-makers to make their own decision-specific model using interactive tools that permit them to generate graphs and input data, charts, and mathematical analyses to teach decision-makers how to use this conceptual model. Various decision options can be quantified and evaluated in the larger context of the conceptual model by using these tools. Fig. 1 shows the components involved in the framework design of the water quality-DSS.
The components of the water quality-DSS approach are many fields as a user interfaces (see Figure 1). 1-interface control panel: contains information about the stations users such as the new authority user interface and station details, 2- Applications interface: Includes the programs for calculating water quality and water pollution. 3-Report: send the water state report for decisions of supplying or not supplying water to the people. The graphical user interface (UI) for water quality-DSS was programmed in visual C#, and SQL server for save database.

Fig. 1. Water quality-DSS Application Framework
3. Water quality-DSS implementation and discussions
Water quality index (WQI) is one of the most effective tools to communicate information about water quality to assist people in making a decision. It becomes an important factor to estimate and manage water, as an indicator. WQI is a mathematical instrument used to transform large quantities of water quality data into a single number, which provides a simple and understandable tool to managers and decision makers concerning water quality. The water quality index provides a single number that expresses the overall water quality at a certain location and moment in time, based on several water quality parameters. Data acquisition is made by 100 unit per water sample and the results are public [11]. The water quality index (WQI) was calculated using the weighted arithmetic index method. The quality rating scale for each parameter (qi) was calculated using Equation (1):
 (1)
(1)
A quality rating scale (qi) for each parameter is assigned by dividing the observed concentration (Ci) for each water sample by its respective standard value (Si) and the result is multiplied by 100. Relative weight (wi) is calculated by a value inversely proportional to the recommended standard value (Si) of the corresponding parameter using Equation (2):
 (2)
(2)
In general, the water quality index (WQI) is calculated by compiling the quality rating scale (qi) with unit weight (wi), written in Equation (3) as follows:
 (3)
(3)
Where qi is the quality parameter, and wi is the weight unit of (i) parameter, n represents the number of parameters, WQI had been discussed for the specific use and meaning of water quality index. In this study we considered WQI for drinking purposes are (100) values using Equation (4).
 (4)
(4)
Based on the calculated WQI, the classification of water quality types are given according to [11], as shown in Table 1.
Table 1
The conditions used to evaluate water quality
No | WQI value | Water quality classification | Water quality |
1 | <50 | Excellent | Excellent (water is clear and not in contact with domestic wastes. Ideal for different purposes. No treatment required). |
2 | 50-100 | Good water | Good (initiation of serious changes in water quality due to environmental deterioration. Useful for domestic and industrial purposes, suitable for wildlife and waterfowl). |
3 | 100-200 | Poor water | Poor (drastic changes in water quality begin to occur the water can be used for domestic and industrial purposes after intensive treatment). |
4 | 200-300 | Very poor water | Very poor (dangerous changes may occur in the ecosystem. Constant disturbing smell. Conventional treatment costs are augmented). |
5 | >300 | Water unsuitable for drinking | Unfit for drinking (highly dangerous pollution. Danger in any form of water consumption). |

Fig. 2. Authintecation window to input water quality data
Figure 2 shows the login page to input water quality data. The user can input a user name and password), and can change his user name and password.

Fig. 3. Main window of data analysis and modeling for water quality calculation
Figure 3 shows the interactive page. The user can input the data of water quality and also perform the analysis to calculate the water quality index. The data analysis and modelling environment can be retrieved through DBMS in order to calculate the water quality and actual water status, which is further provided as an input for analyzing the ecosystem model to obtain actual advice and benefits of the distinct practices for avoiding water pollution. Furthermore, a simulation report generation service was also provided to the client to facilitate a comparative analysis of different possible planning strategies to achieve an optimal solution. All information is stored in a meta-database. The user will input data in (Ci) column only, which represents the observed concentration of each water sample, the rest columns will be automatically calculated and will display the data analysis result.
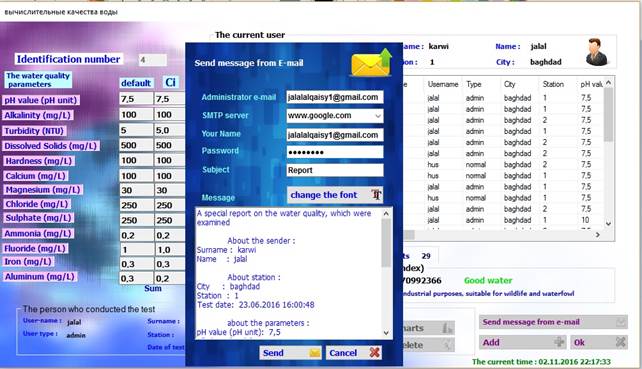
Fig. 4. Main window to send an e-mail report of each data analysis for the stations
The report containing all this information can be sent via email. Figure 4 shows the main window that allows printing of data after calculating the water quality parameters, which attach information file to an alert mail to provide a suitable decision basis to the water authority.
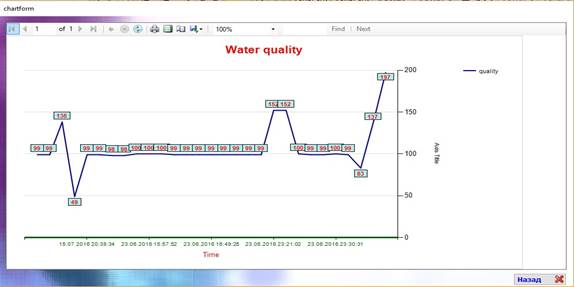
Fig. 5. Time series of all water parameters in the stations
Figure 5 shows the variation of water quality parameters in the stations. From these, we can choose the date of the input data from the retrieval button and make a comparison between the parameters. Finally, the report containing all this information is sent to the water station suppliers (figure 6).

Fig. 6. An example for input data for calculating the water quality index
Figure 6 displays the data analysis result used for calculating the water quality index (see the equations above). Table 1 shows the conditions used to evaluate water quality which, if the WQI value is 100-200, then the water quality status is poor water (see Table 1). Finally the program will send an email report to the authority person which includes all the test information.
4. Conclusions
The design and implementation of an environmental decision support system is a challenge in multi-criteria, involving software engineering, environmental modelling, as well as service and data semantics. In this paper, we have proposed an application for environmental crises, water management systems incorporating data and presentation services as well as dynamically selected simulation models able to calculate water quality status from real time. Also, we have provided the analysis tools for estimating strategies to avoid water pollution effects resulting from the waste industry, oil pollution and different causes. The present prototype of the water quality-DSS is limited to 13 environmental criteria water quality and 24 for water pollution. In this study, a hybrid decision support system was designed and developed based on a scoring method and experimental results. A rule-based system was also created. This system has the potential to provide useful information for the optimum selection of water treatment combinations depending on the type of application and target water quality. In the case of water pollution, various causes are observed and processed by using a mathematical model. The program compares the real value of pollution parameters with the standard value of these parameters in order to identify the kind of pollution and to give an appropriate suggestion for the water pollution treatment. The water quality-DSS system automatically computes and measures the water quality. The water quality-DSS services provide water management inputs, such as the measured water quality or the water pollution test per water application unit. In the future, based on the feedback received from users, we hope to optimize the water quality-DSS by collecting improved data sets and addressing the additional environmental criteria identified by the users.
Acknowledgments
Thanks to the Ministry of Higher Education & Scientific Research, IRAQ.


Список литературы
Список использованной литературы появится позже.